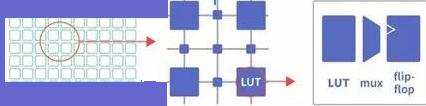
FPGA based Digital World
Welcome to FPGA based Digital World.
Signal processing is much important. |
Complex Number
Complex number was inveneted to solve the problem of x*x = q, where q is a negative real number.
Representations
A complex numbercan be represented in different forms.
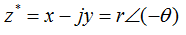
Rectangular form

where

x is the real part(Re) and y is the imaginary part(Im).
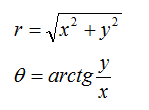
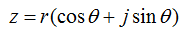
Polar form

where, r is called the modulus (or absolute value or norm) of z.
θis determined up to an integer multiple of 2π, and the value of any of these angles is called an argument of z, denoted Arg z. While the argument that lies in (-π,π) is known as the principle value of the argument, denoted as arg z.
Exponential Form

or
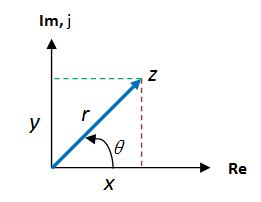
Graphical Representation
A complex number can be expressed graphically.
1) A point with coordinates of (x,y) in the complex plane(or z plane)
2) A vector pointing to (x,y) point
Properties
Euler's Formula
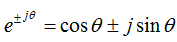
so,
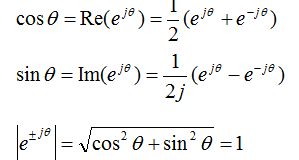
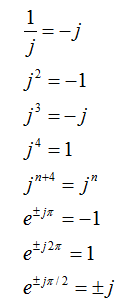
Other properties
Mathematical Operations
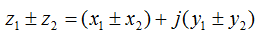
Addition and Subtraction
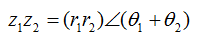
Multiplication
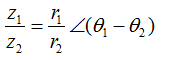
Division
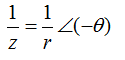
Recipical
Complete Conjugate
Function of a Complex Variable
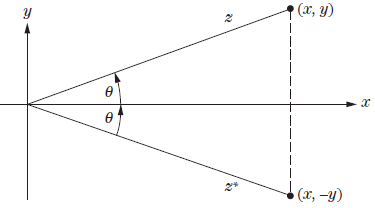
Complex functions w (z) are constructed from complex variable z(=x+jy), as below.
w(z) = u(x,y) + jv(x,y)
The relationship between the independent variable z and the dependent variable w can be pictured as a mapping operation, as shown below.
Complex Number in Matlab
1) Generate a complex number
a = 2.5 + 5.9i
a = complex(2.5,5.9)
2) Get the real part, imaginary part,magnitude
real(a), imag(a), abs(a)
3) Get the angle
angle(a) - in rad
angle(a)*180/pi-- in degree
4) Get the conjugate
conj(a)
5) Draw complex function
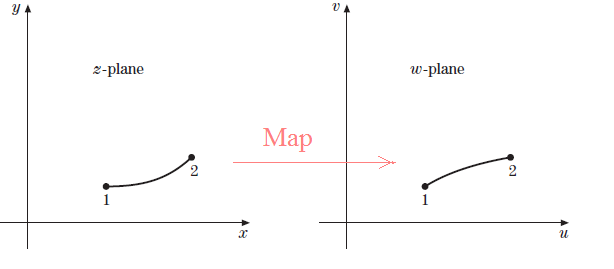
The complex function z = f(x,y), can be graphed, over some finite domain, as the height of a 3D surface, a density plot, or a set of contour lines.
In matlab, it can be graphed with the height of the 3D surface as well as the surface color.
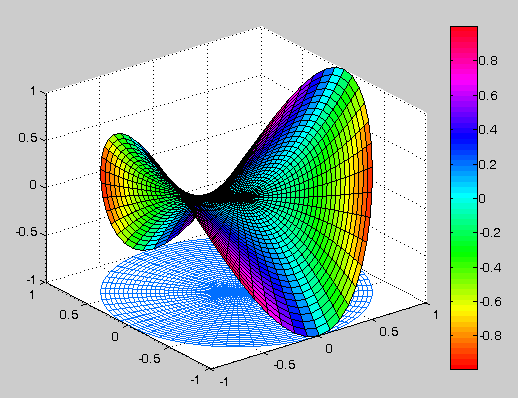
[example]plot the curve of Z^2.
z=cplxgrid(30);
w=z.^2;
cplxmap(z,w);
[Note]cplxmap(z,w) has the similar result to the one of below command.
surf(real(z),imag(z),real(w),imag(w))
where x and y axes represent the real and imaginary parts of the input, while z axis represents the real part of the output and the color represents the imaginary part of the output.
The result is shown below.

| Altera/Intel | Xilinx | Lattice | Learn About Electronics |
| MircoSemi | Terasic | Electric Fans |
| All rights reserved by fpgadig.org |