FPGA based Digital World
Welcome to FPGA based Digital World.
Signal processing is much important. |
Sinc Wave and its Spectrum
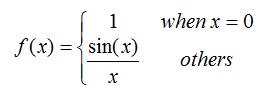
Sinc is the abbreviation of 'sine cardinal' here, and a sinc function is defined as
with its waveform shown below.
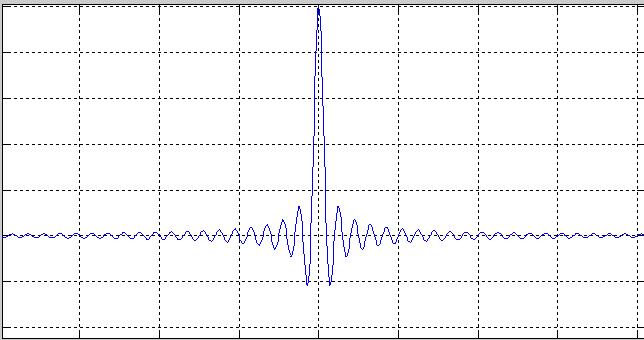
A sinc function is sometimes called 'sampling function', coming from the therory of Fourier Transfom. The rectangular function and sinc function are Fourier Transform pairs.
![]()
Below is an example to draw the waveforms of a sinc function and its sqaure funtion(sinc^2) in time domain as well as in frequency domain with matlab.
%-------------------------------------------
% Example to calculate the spectrum of sinc
% ------------------------------------------
clear
% Overal Paramters
f0 = 5; %frequency of the cosine wave, Hz
fs = 100; %Sampling frequency, in Hz; must be >2*f0
N = 512; %Sampling Number
% Sampling
for i=1:N
t(i) = (-N/2+i)/fs; %t=-N/2+1 to N/2
X(i) = 2*pi*f0*t(i); % omg*t
if( X(i) == 0 )
Xt(i) = 1; % should not be infinite
else
Xt(i) = sin(X(i))/ X(i); %sinc function
end
SqrXt(i) = Xt(i)*Xt(i); % sinc^2
end
% Call Power spectrum
[Freq_Sinc, dbmPower_Sinc, Phase] = calc_spec(Xt, N, fs);
[Freq_SqrSinc, dbmPower_SqrSinc, Phase] = calc_spec(SqrXt, N, fs);
% Plot original signal in time domain
figure(1);
subplot(221);
plot(t, (Xt));
xlabel('t(s)');
ylabel('sinc');
title('Sinc Signal(time domain)');
grid;
subplot(223);
plot(t, SqrXt);
xlabel('t(s)');
ylabel('sinc^2');
title('Sinc^2 Signal(time domain)');
grid;
% Plot Power Spectrum in frequency domain
subplot(222);
plot(Freq_Sinc, dbmPower_Sinc);
xlabel('Frquency(Hz)');
ylabel('Power(dbm)');
title('Sinc Power Spectrum');
grid;
subplot(224);
plot(Freq_SqrSinc, dbmPower_SqrSinc);
xlabel('Frquency(Hz)');
ylabel('Power(dbm)');
title('Sinc^2 Power Spectrum');
grid;
And the running result is shown below(the frequency of the sinc wave is 5Hz in the example).
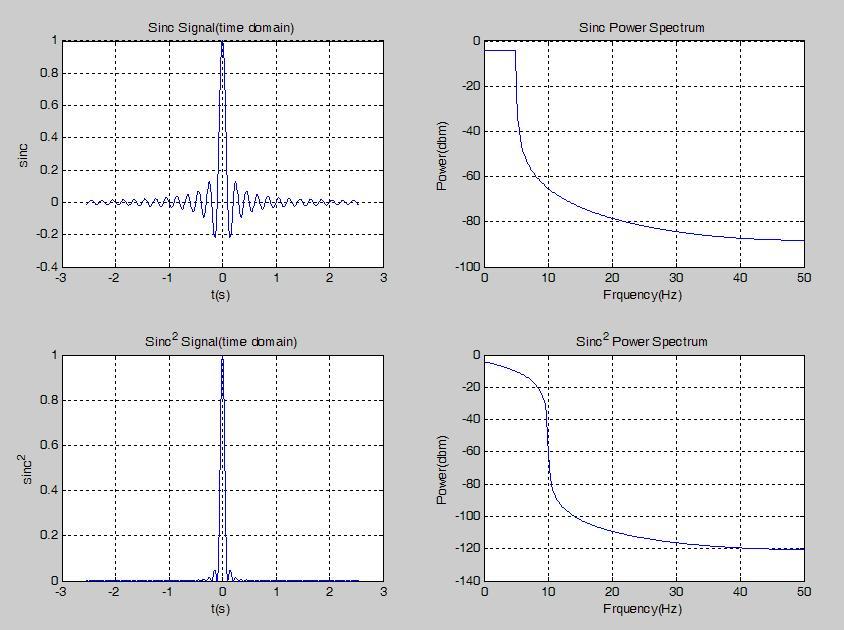
It can be derived from above picture that the square of sinc function doubles the frequency range of its correspondign sinc function.
To study the influence of different frequencies, the waveforms of sinc and sinc^2 functions with different frequencies are compared in one diagram, and realized by below matlab code.
%-------------------------------------------------------------------
% Example to compare the sinc spectrum of different frequencies
% ------------------------------------------------------------------
clear
% Overal Paramters
f0 = 5; %frequency of the cosine wave, Hz
fs = 100; %Sampling frequency, in H; must > 2*f0
N = 128; %Sampling Number
%Set Figure properties
curv_clrs = 'rgbcmykw'; %different colors
figure(1);
subplot(221);
xlabel('t(s)');
ylabel('sinc');
title('Sinc Signal(time domain)');
grid;
subplot(223);
xlabel('t(s)');
ylabel('sinc^2');
title('Sinc^2 Signal(time domain)');
grid;
subplot(222);
xlabel('Frquency(Hz)');
ylabel('Power(dbm)');
title('Sinc Power Spectrum');
grid;
subplot(222);
xlabel('Frquency(Hz)');
ylabel('Power(dbm)');
title('Sinc Power Spectrum');
grid;
subplot(224);
xlabel('Frquency(Hz)');
ylabel('Power(dbm)');
title('Sinc^2 Power Spectrum');
grid;
for FrqNo = 1:6 %Frequencies, each multplied by f0
% Sampling
for i=1:N
t(i) = (-N/2+i)/fs; %t=-N/2+1 to N/2
X(i) = 2*pi*f0*t(i)*FrqNo; % omg*t
if( X(i) == 0 )
Xt(i) = 1; % should not be infinite
else
Xt(i) = sin(X(i))/ X(i); %sinc function
end
SqrXt(i) = Xt(i)*Xt(i); % sinc^2
end
% Call Power Spectrum Calculation in matlab
[Freq_Sinc, dbmPower_Sinc, Phase] = calc_spec(Xt, N, fs);
[Freq_SqrSinc, dbmPower_SqrSinc, Phase] = calc_spec(SqrXt, N, fs);
% Plot original signal in time domain
subplot(221);
hold on;
plot(t, (Xt),curv_clrs(FrqNo));
subplot(223);
hold on;
plot(t, SqrXt,curv_clrs(FrqNo));
% Plot Power Spectrum in frequency domain
subplot(222);
hold on;
plot(Freq_Sinc, dbmPower_Sinc,curv_clrs(FrqNo));
subplot(224);
hold on;
plot(Freq_SqrSinc, dbmPower_SqrSinc,curv_clrs(FrqNo));
end;
And below is the result.
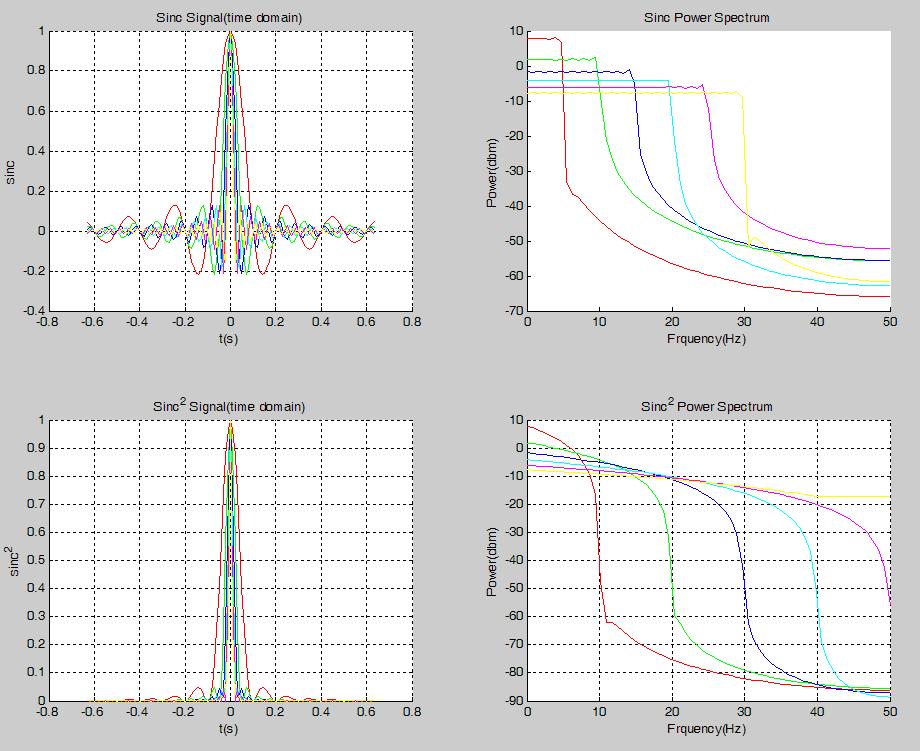
It can be seen that the hihger the sinc frequency is, the narrower is the waveform in the time domain.
P.S., matlab code to calculate the power spectrum is listed here.
%--------------------------------------
% Calcuate the spectrum of a signal in time domain
% Xt -- Signal in time domain
% FFTNum -- Number of FFT
% Fs -- Sampling Freqency, in Hz
% Freq -- Frequency vector, with size of FFTNum/2+1
% dbmPower -- Power vector, in dbm
% Phase -- Phase,in degree
function [Freq, dbmPower, Phase] = calc_spec(Xt, FFTNum, Fs)
% Call FFT(DFT) function in matlab
Xf = fft(Xt,FFTNum);
ValidNum = FFTNum/2+1;
ValidXf = Xf(1:ValidNum);
% Calculate magtitude and phase of the FFT
Freq = (0:ValidNum-1)'*Fs/FFTNum; % Corresponding frequency array
Mag = abs(ValidXf/FFTNum);
Phase = angle(ValidXf)*180/pi; % in degree
% Calculate Power
Power = Mag.^2;
dbmPower = 10*log10(Power*1000);
end
| Altera/Intel | Xilinx | Lattice | Learn About Electronics |
| MircoSemi | Terasic | Electric Fans |
| All rights reserved by fpgadig.org |